Here you will find a host of example figures with the code that generated them. The Forth source code
is put side-by-side with Python prototype examples found here.
The plots are shown in their jpeg, png and Postscript forms.
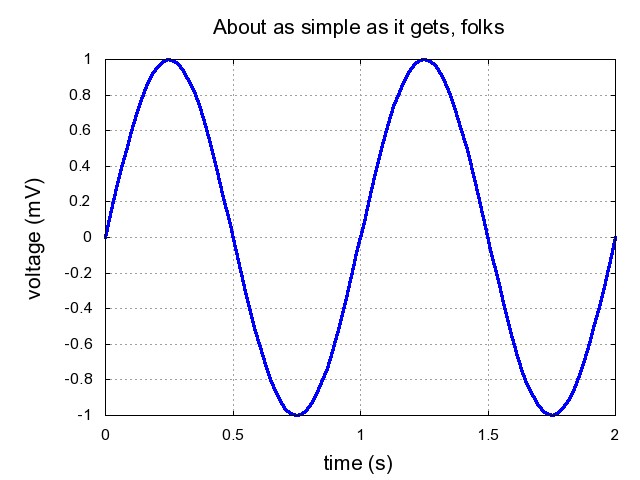
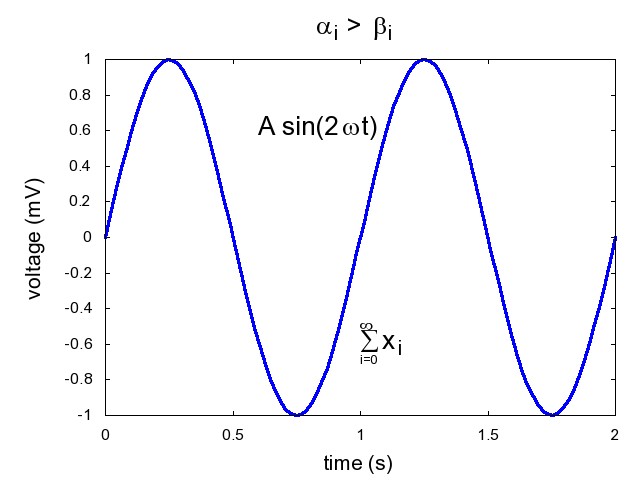
The most basic plot, with text labels
[source code, postscript, png]
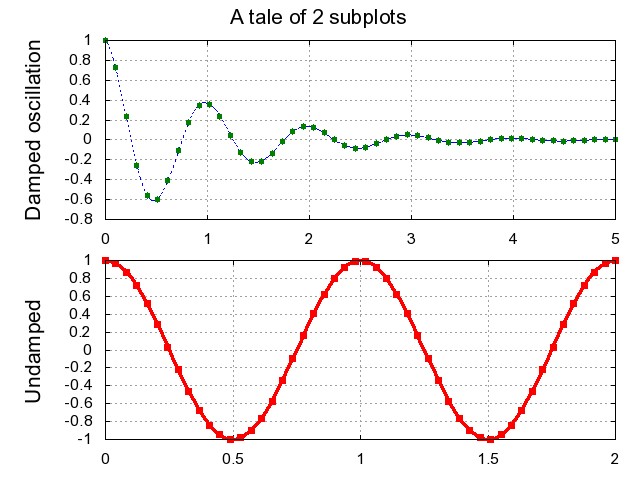
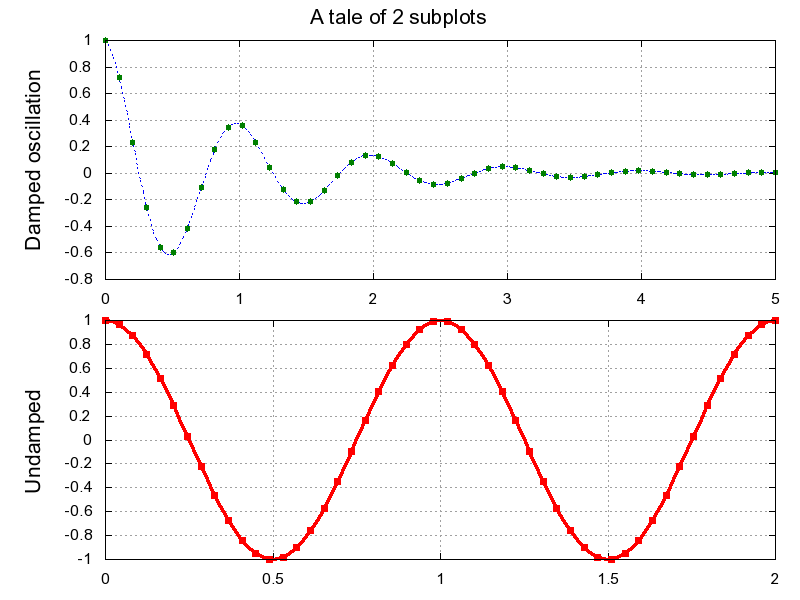
Multiple regular axes (#rows by #columns) are created with the subplot command.
[source code, postscript, png]
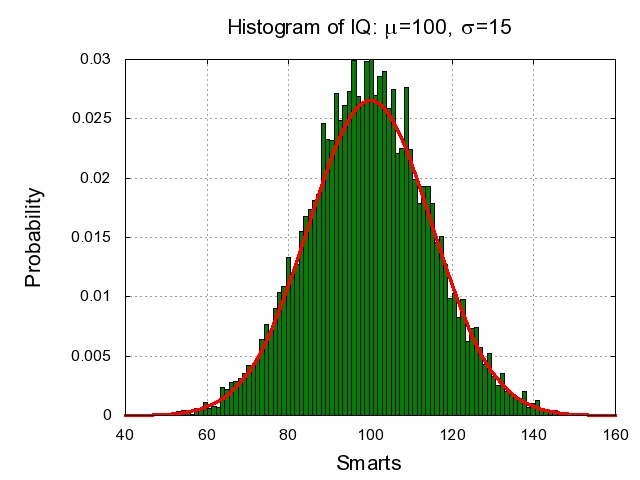
The hist command automatically generates histograms and will return the bin counts or probabilities
[source code, postscript, png]
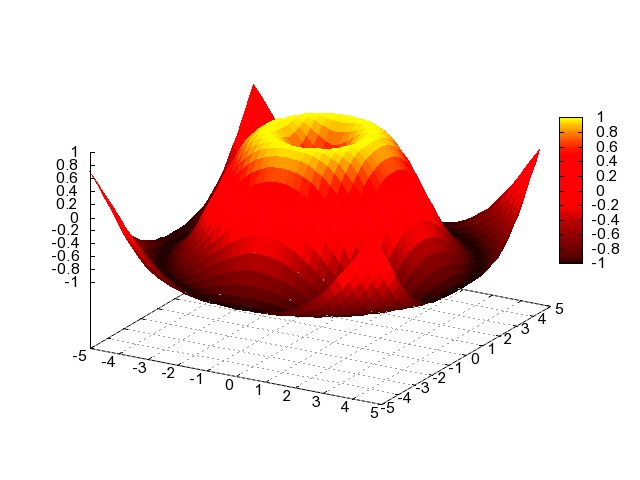
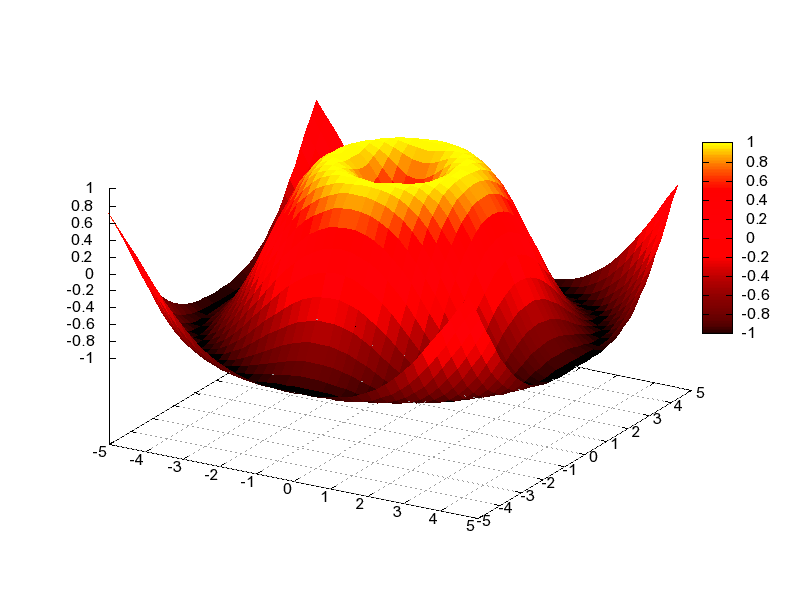
The splot tool has support for simple 3d surface graphs.
[source code, postscript, png]
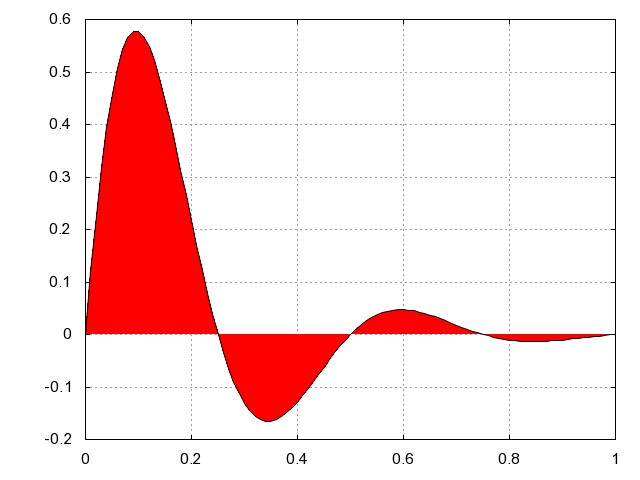
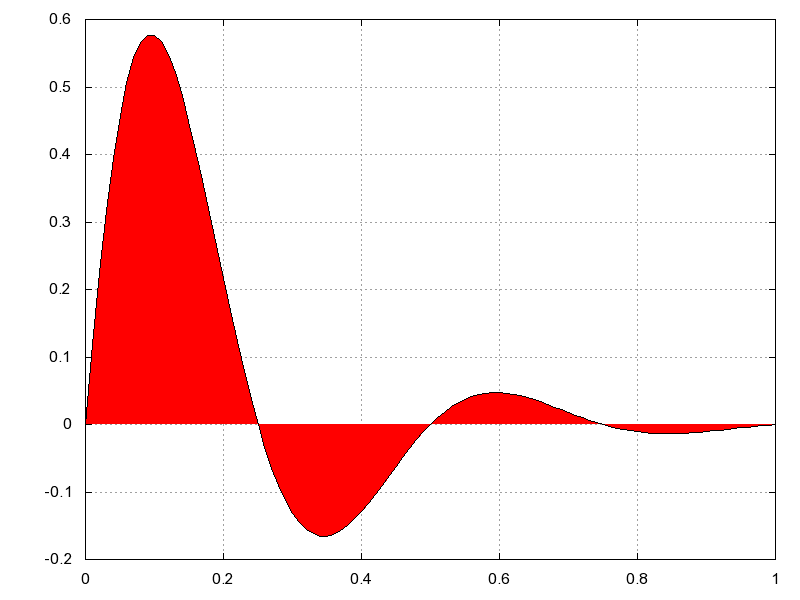
The fill command lets you plot filled polygons.
[source code, postscript, png]
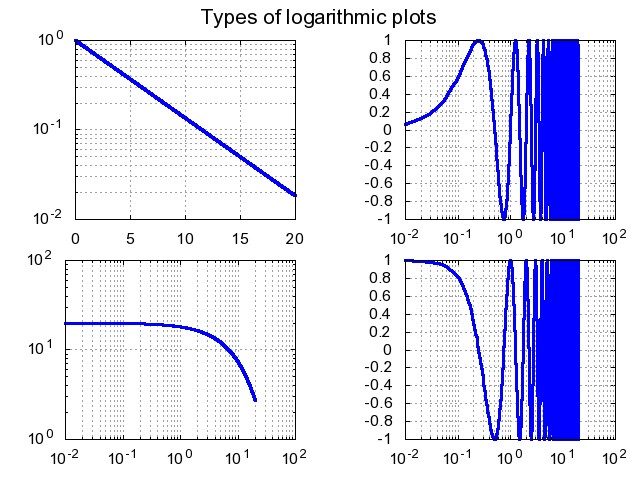
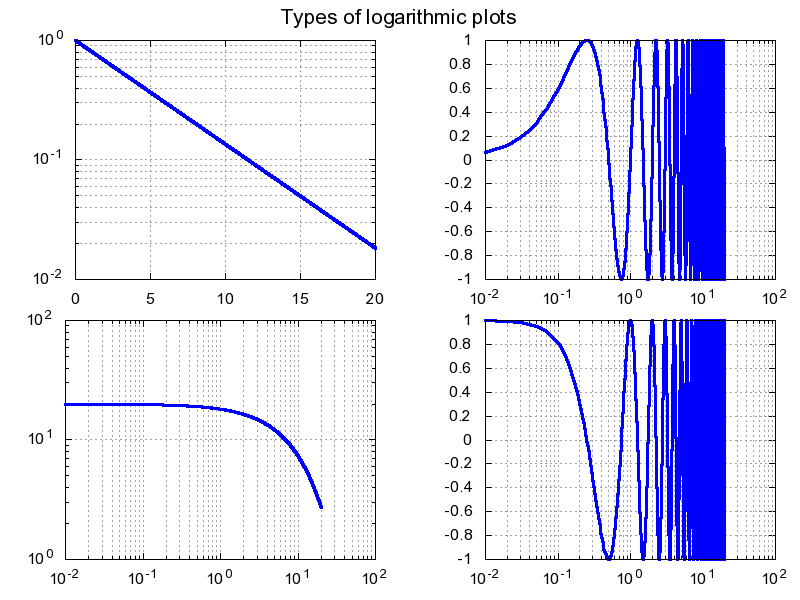
The semilogx,
semilogy and
loglog functions generate log scaling on the respective axes. The lower subplot uses a base10 log
on the x and y axis.
[source code, postscript, png]
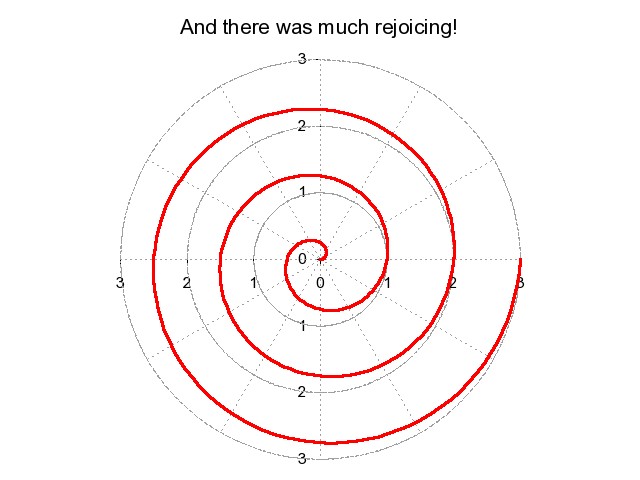
The [polar .. polar] environment generates polar plots.
[source code, postscript, png]
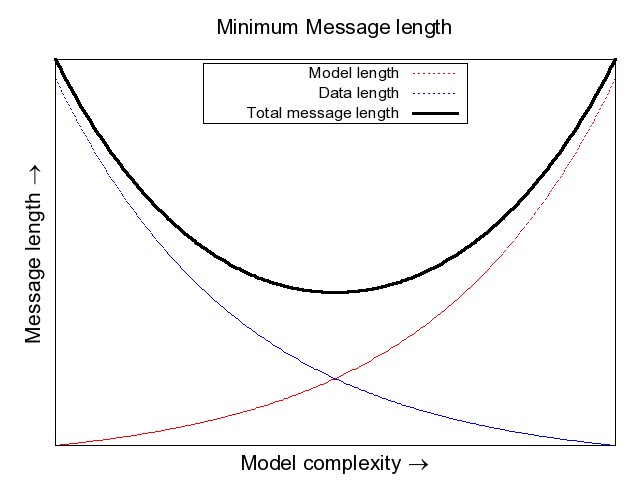
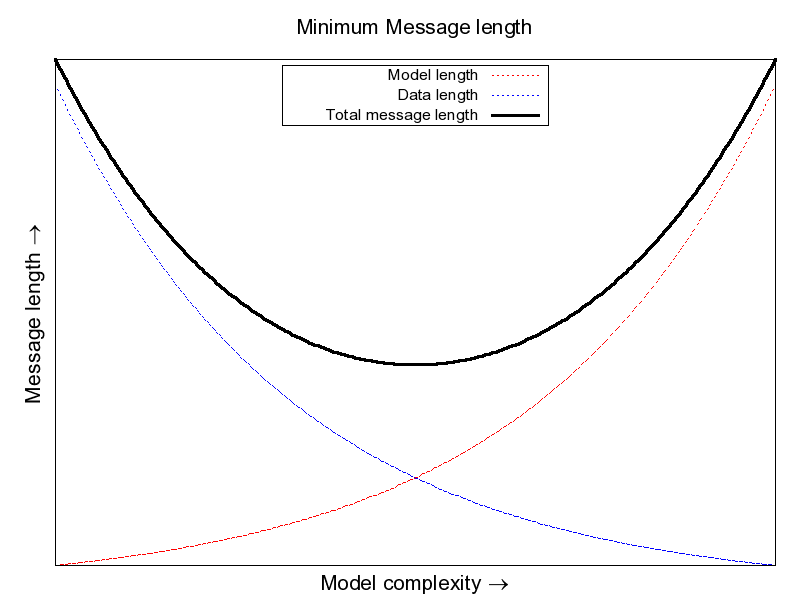
The legend command automatically generates figure legends, with Matlab compatible legend placement commands.
[source code, postscript, png]
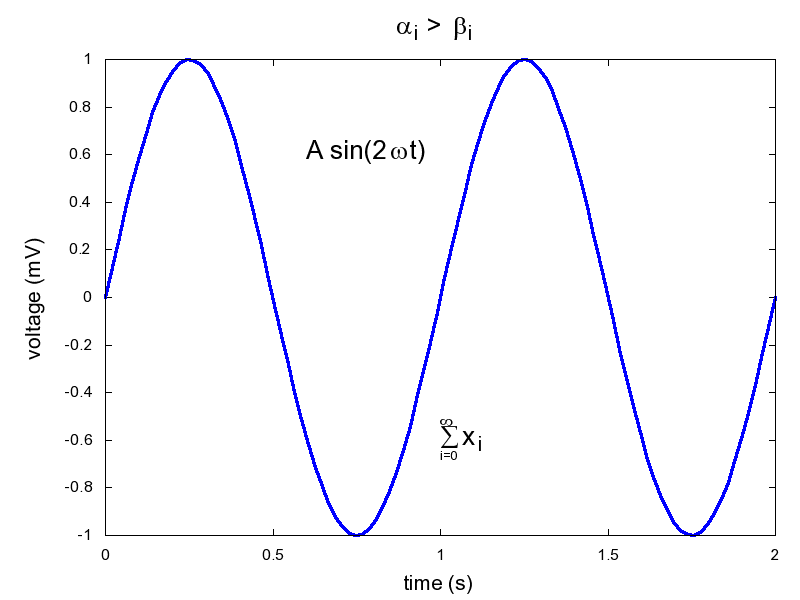
A sampling of the TeX expressions now supported by gnuplotlib's internal mathtext engine. The mathtext module provides TeX style mathematical expressions using freetype2 and the BaKoMa computer modern or STIX fonts.
[source code, postscript, png]